
The effects of B.C.'s foreign homebuyer tax on detached home prices vary by region, recently released data suggests.
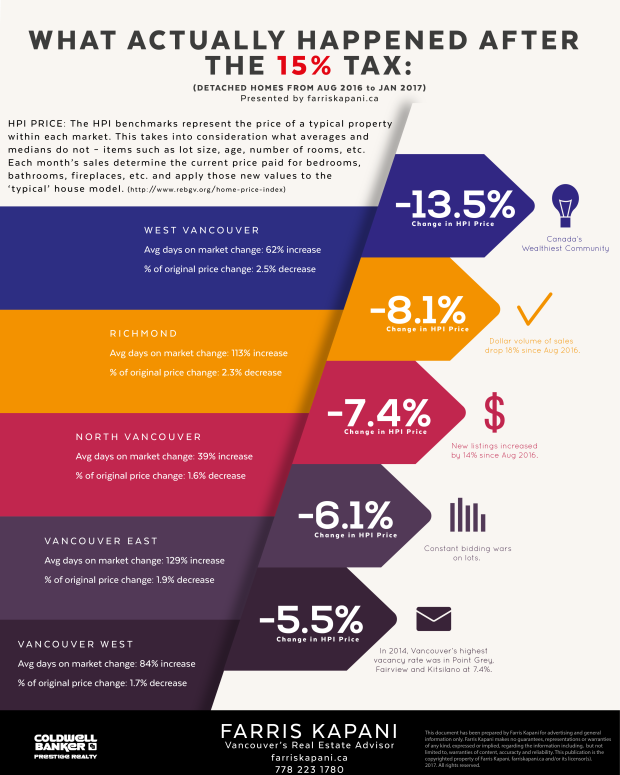
An infographic complied by Vancouver realtor Farris Kapani and sent to CTV News this week shows that benchmark home prices have dipped between 5.5 and 13.5 per cent in some Metro Vancouver markets.
- Click here or scroll down for the infographic
The infographic does not take into account the annual slowing of sales during the winter months, but it does show a dip in home price benchmarks across all five markets examined.
The data, gathered from the Real Estate Board of Greater Vancouver, compares home price index (HPI) benchmarks from August 2016 to those released at the end of January 2017.
HPI benchmarks differ from averages or medians because they take into account the size of the lot a home is on, the age, number of room and more factors. Benchmarks for the "typical" home are compiled each month based on sale prices.
Kapani looked at how the benchmarks for detached homes changed from data released in August – when the 15 per cent tax took effect – to the numbers released six months later. The infographic compares data from five regions of Metro Vancouver: West Vancouver, North Vancouver, Vancouver East, Vancouver West and Richmond.
The numbers suggested the market affected most by the tax was West Vancouver, where the HPI benchmark dropped 13.5 per cent. Detached homes were selling for a benchmark of $3,359,400 in August, but were down to $2,907,100 in January.
The number of average days on the market increased by 62 per cent in West Vancouver, Canada’s wealthiest municipality, the data showed.
Sales often in the winter months in most markets, so CTV News pulled the same numbers for the previous year, and found that the HPI benchmark from August 2015 to January 2016 actually increased by 9.3 per cent in West Vancouver. Sales also increased from August 2014 to January 2015 by 3.1 per cent.
In Richmond, the benchmark was down 8.1 per cent from August 2016 to last month, and the average number of days on the market increased by 113 per cent.
North Vancouver was the next market that appeared hardest hit, seeing a benchmark decrease of 7.4 per cent. The benchmark had increased by 13.7 per cent in North Vancouver the year before.
In Vancouver East, the typical home sold for 6.1 per cent less last month than in August. The previous year, the benchmark increased by 6.3 per cent in the same six-month period.
Vancouver West had the lowest decrease of the five markets included in the infographic at 5.5 per cent. The benchmark had increased by 8.7 per cent during the same period the previous year.
The average number of days on the market increased in all five areas, with the most dramatic increase in Vancouver East, and the lowest increase in North Vancouver.
August vs. January benchmarks for other types of housing
The infographic only compared detached homes, but data pulled on other types of homes during the same period shows how condos and townhouses fared in each market.
Data was not available through the REBGV on West Vancouver townhouses, but the benchmark price for an apartment increased by 1 per cent during the six-month period.
Also on the North Shore, the benchmark for townhouses in North Van decreased by 7.7 per cent, while the typical condo sold for 2.5 per cent less in January than in August.
In Richmond, townhouses dipped 0.9 per cent in January, but the condo benchmark increased by 4.7 per cent.
North of Richmond, Vancouver West townhouses sold for 3.6 per cent less in January than in August, and condos sold for 4.2 per cent less.
The Vancouver East townhouse benchmark was 5.9 per cent lower in January, and the condo benchmark also decreased, but only by 0.2 per cent.
Want to know more about changing benchmarks in your neighbourhood? Reports are available through the REBGV online.