

VANCOUVER -- New data released by the provincial government Thursday shows the location of COVID-19 cases in British Columbia in greater detail than ever before.
Provincial health officer Dr. Bonnie Henry presented the new map at her briefing on the coronavirus Thursday afternoon. The colour-coded map shows how many British Columbians tested positive for the virus between Jan. 1 and July 31 in each of the province's "local health areas."
Henry explained that those subdivisions of the regional health authorities are smaller than the ones the province has used in previous reports.
"Early on, as you know, we reported by health authority only because of the risk of identification of an individual with small numbers," the provincial health officer said Thursday. "As we have had more cases here in B.C., we were able to provide data to communities and to the public by what we call 'health service delivery area,' so a smaller geographic area. We are now at the point where we have sufficient data over time that we can even go more granular than that."
The map also shows how many COVID-19 cases per 100,000 residents each local health area had recorded as of the end of July.
Henry said the province plans to update the map "on a periodic basis," depending on the number of new cases the province records and its ability to maintain people's confidentiality.
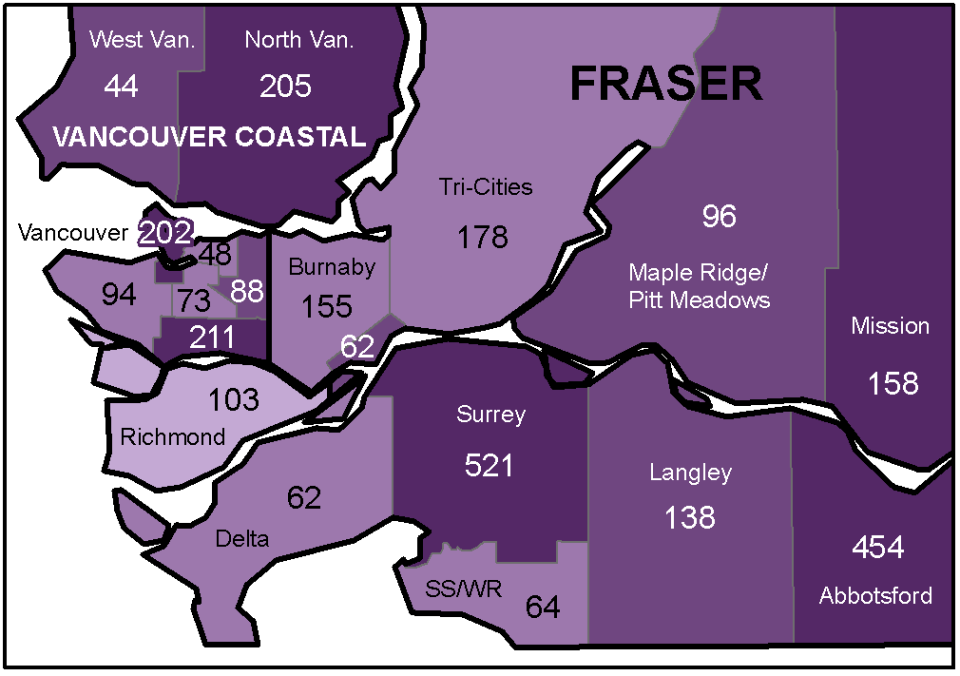
The highest number on the map released Thursday is found in Surrey, where there had been 521 cases of COVID-19 confirmed as of July 31. That total equates to just over 14 per cent of all cases that had been recorded in B.C. at the time.
Surrey is not the municipality with the highest number of cases on the map, however. The City of Vancouver is subdivided into six different regions. Added together, the total number of cases in the city at the end of July was 716, almost 20 per cent of all cases in B.C. as of July 31.
Within Vancouver, Downtown and South Vancouver are the local health areas with the highest case totals on the map, recording 202 and 211, respectively. Each of the other four areas in the city has fewer than 100 cases.
Indeed, the only other local health areas on the map showing more than 200 cases as of late July are Abbotsford (454 cases), North Vancouver (205) and Central Okanagan (209).
Of course, the raw number of cases in a given region doesn't necessarily indicate the severity of the pandemic there. Twenty cases in a place with 2,000 residents is a significantly larger proportion of the overall population than 20 cases in a place with 200,000 residents.
Henry also cautioned that the map shows where people reside, not necessarily where they contracted the coronavirus. She urged the public to continue taking precautions to avoid contracting COVID-19 regardless of where in B.C. they live.
"Virtually every part of our province has been touched by COVID-19: communities large and small and geographically dispersed," Henry said. "We must continue to find our balance and understand how we can continue to live with COVID-19 over the coming months."
The local health areas with the largest numbers of confirmed cases per 100,000 residents as of the end of July were Surrey, North Vancouver, Downtown Vancouver, South Vancouver, Abbotsford and Mission, as well as Vancouver Island North and Haida Gwaii.
Each of those regions had at least 100 cases per 100,000 residents, as of July 31, according to the colour-coding on the map.
It's worth noting that Vancouver Island North and Haida Gwaii each had fewer than 100 cases total, meaning their higher per-capita totals are, in part, a reflection of smaller populations.
Also notable is the fact that, despite having one of the highest raw case totals, the Central Okanagan area does not top the 100 per 100,000 threshold. According to the map, that region had between 75 and 100 cases per 100,000 residents as of late July.
The full-sized map can be found here.