
VANCOUVER -- Metro Vancouver and Whistler continue to be the hottest of hotspots for COVID-19 infections in B.C., while caseloads in the north of the province have been shifting from the coast to the Interior, according to the latest map from the B.C. Centre for Disease Control.
Provincial health officer Dr. Bonnie Henry presented the data during her news conference on B.C.'s modelling of the pandemic Thursday afternoon, providing some additional context to the latest geographic representation of coronavirus cases.
"There are some areas that continue to have ongoing high rates of transmission and in some areas we've seen different hotspots show up in the last few weeks," Henry said.
As an example, she started by highlighting cases in Northern Health, where "local health areas" along the coast had been a focal point of the pandemic earlier in the year.
Because of the rapid spread of the coronavirus in the City of Prince Rupert, health officials offered COVID-19 vaccines to all adults in that community.
On the latest BCCDC map, which shows coronavirus infections detected during the week of April 4 to 10, the Prince Rupert local health area saw 27 new cases.
That's the equivalent of more than 20 cases per 100,000 residents per day, which is the highest per-capita caseload shown on the colour-coded map.
It's also dramatically lower than the 72 new infections Prince Rupert recorded the preceding week.
As cases in Prince Rupert and the surrounding local health areas have declined in recent weeks, cases on the Alberta border have been increasing.
The local health area known as Peace River South saw 118 new infections during the week shown on the most recent map. That's up from 115 the week before and 92 the week before that.
"We've seen a transition in the north from the northwest to the northeast, and partly that is because of the vaccination program that we've had in communities across the north that have brought down rates of transmission in some of those communities," Henry said Thursday, referencing the Prince Rupert effort.
Elsewhere in the province, the Lower Mainland continues to make up the vast majority of the new infections B.C. is seeing.
All but two local health areas within Metro Vancouver are shown on the map in the dark red colour that indicates more than 20 daily cases per 100,000 residents during the week in question.
The two regions that escape this dubious distinction are Richmond, which saw 266 cases during the week that ended April 10, and Langley, which saw 210. Those numbers each equate to between 15 and 20 cases per 100,000 residents on a daily basis.
The highest overall case counts in Metro Vancouver were in Surrey, where 1,573 new infections were recorded, the Tri-Cities, which saw 514 new cases, and Burnaby, which saw 473.
Notably, the City of Vancouver is subdivided into six different local health areas, each of which recorded at least 120 cases during the week shown on the map. Adding those regions together yields a total of 1,297 infections detected in the city during the week.
Henry said looking at the geographic distribution of cases across the province helps health officials determine how and when to target B.C.'s vaccination plan.
Surrey's persistently high caseload is the reason the city has been the starting point for vaccination programs for teachers and first responders in recent weeks, Henry said.
"We've seen ongoing high rates of transmission in Surrey," she said Thursday. "That's been, steadily, a high-transmission area throughout the pandemic."
The provincial health officer's presentation included some additional information not shown on the map that she said also helps guide vaccination decisions.
While the highest range of per-capita cases shown on the map is 20 or more per 100,000 residents per day, Henry's presentation showed a more exact calculation of per-capita cases in some hard-hit regions.
Surrey's average daily rate of new cases per 100,000 residents is close to 50, significantly higher than the next highest region, Abbotsford, which recorded about 35 cases per 100,000 residents per day from April 7 to 13, according to Henry's presentation.
Peace River South is even further ahead among local health areas in the Northern Health authority, averaging about 60 cases per 100,000 residents, more than double the rate seen in the next-highest region, Peace River North.
But neither Surrey nor Peace River South has the highest density of cases for its population in B.C. That distinction goes to Howe Sound, the local health area that includes Whistler. The region recorded nearly 80 cases per 100,000 residents from April 7 to 13.
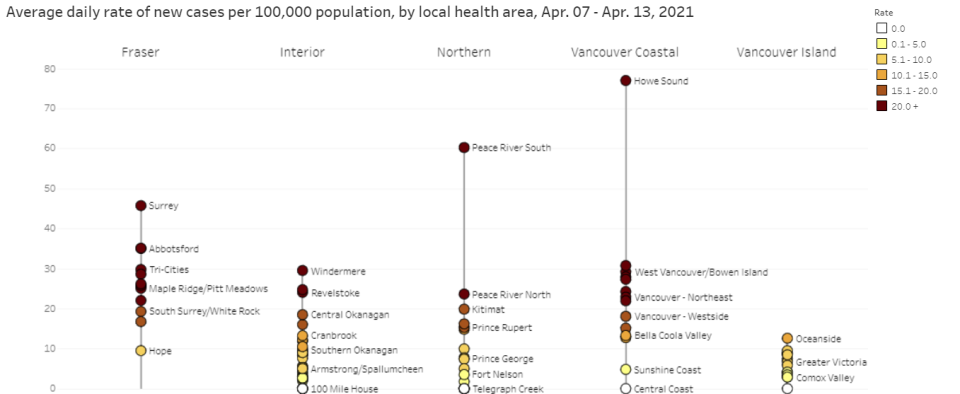
"This was one of the pieces of information that we used to address the outbreaks that were happening in Whistler since January," Henry said Thursday. "We've seen this rate fluctuate because of the outbreak measures that were taken there, and it is one of the things that we've used that helped drive the decision to provide immunization to workers in the community in Whistler."
Vancouver Coastal Health announced over the weekend that all adult Whistler residents would be offered a COVID-19 vaccine, regardless of age, as would people who live in surrounding communities and work in Whistler.
Henry's presentation on COVID-19 modelling in B.C. is embedded below. The full-size version of the latest BCCDC map can be found here.