Canadian kids are getting a failing grade when it comes to healthy eating at school.
That's what a new University of British Columbia study has found while examining kids' intake of vegetables, fruit and dairy products during school hours.
Lead author Claire Tugault-Lafleur said the results mean children are falling short of several dietary recommendations on school days – and there's an opportunity for schools to promote healthier eating.
Researchers examined the eating habits of nearly 5,000 Canadian students between the ages of six and 17, examining what they ate and drank while in school.
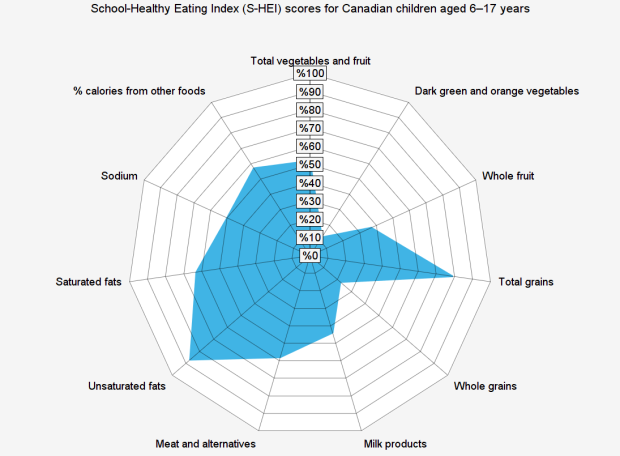
The survey's School-Healthy Eating Index (S-HEI) compared the calories consumed from foods like fruits and veggies, whole fruit, whole grains, milk products, unsaturated fats and sodium.
The kids scored an average of 53.4 out of 100 points when it comes to 11 key components that make up a healthy diet.
"[It] suggested substantial room for improvement," it said.
While children take in approximately one-third of their daily calorie intake during school hours, the study suggested that intake of certain nutrients, like calcium and vitamin D, was much lower.
At the same time, the intake of junk food like sugar-sweetened beverages, salty snacks and candies, was significantly higher.
Older children, aged 14 to 17, were found to have poorer diet quality than children six to eight years old.
The study used data compiled from the 2004 Canadian Community Health Survey.
Tugault-Lafleur plans to compare the results with the new 2015 data set published this month.
“I’d like to see if there are some places in the country where we see greater improvements in school-hour diet quality, and whether different initiatives or school nutrition policies were implemented in these regions from 2004 to 2015,” she wrote.
It's believed that the study, published Wednesday in Applied Physiology, Nutrition and Metabolism, is the first that looks at differences in dietary intake patterns between school and non-school hours.