One-in-five B.C. renters spend more than 50 per cent of their income on housing and utilities, newly released data suggests.
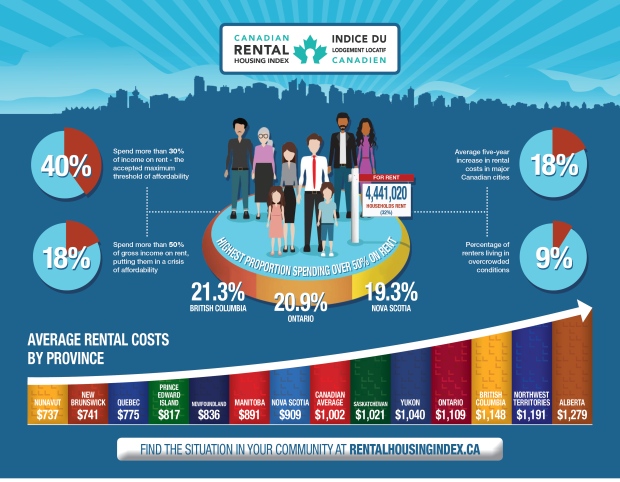
A Statistics Canada survey on rental affordability across Canada found the western-most province had the highest share of renters shelling out at least 50 per cent of their paycheques, at 21.3 per cent.
Coming in at a close second, 20.9 per cent of Ontario residents surveyed said they spent more than half their salary on rentals. In Nova Scotia, 19.3 per cent said they spent more than half of their gross household income, compared to 17.1 per cent in Newfoundland and Labrador, and 16.4 per cent in Saskatchewan.
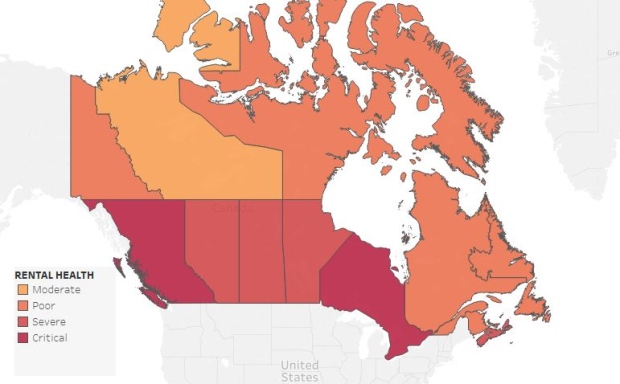
The Canadian Rental Housing Index ranked the rental situations in B.C. and Ontario as "critical" (20 per cent or higher), while the rest of the top five were considered "severe." Alberta also falls into the latter category, ranked 6th overall.
Rental housing affordability was ranked "poor" in Nunavut, Newfoundland and Labrador, Quebec, P.E.I., New Brunswick and the Yukon, while the Northwest Territories was considered "moderate."
On average, the data suggested about half of renters across Canada spend more than the recommended 30 per cent on housing, and that rental rates have far surpassed wage increases, especially in urban centres.
But the CRHI also showed housing affordability issues in suburban and rural areas across the country as rates go up in response to an increase in renters who are unable to afford life in the city.
"Traditionally, spending 30 per cent or less of household income on rent has been viewed as the benchmark of what is considered affordable," said Jill Atkey of the BC Non-Profit Housing Association.
"However, the data shows that spending more than 30 per cent of income on housing has become the new normal for individuals and families in almost all areas of Canada."
Want to know more about a specific section of the report? Click any of the maps embedded in this article to view the interactive data on the CRHI website.
'Rental health' regional breakdown
While B.C. was considered the least affordable province in terms of rentals, it was Ontario's capital that was ranked most critical city in the country when it came to "rental health."
The Greater Toronto Area, including York and Peel regions, was ranked the worst by StatsCan, with the municipalities of Richmond Hill, Markham, Toronto and Mississauga being the least affordable municipalities.
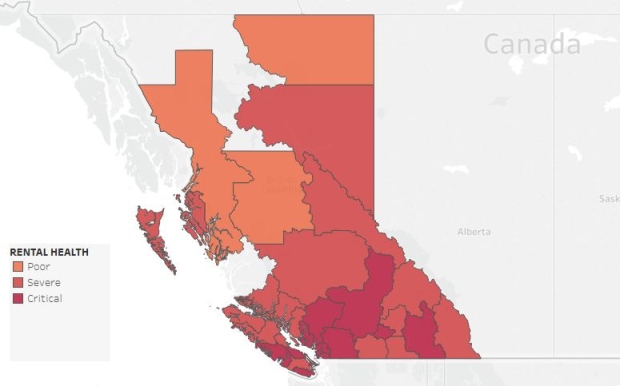
Unsurprisingly, Metro Vancouver followed with Burnaby, Richmond and Coquitlam considered the most expensive cities when compared to residents' average income. The Vancouver area has fewer renters than Toronto due to smaller population, and its median income is about $3,600 higher.
About 23 per cent of GTA renters spent 50 per cent or more of their salaries on housing costs, compared to 22 per cent in Vancouver.
Also among B.C.'s least affordable regional districts were Whistler, the Sunshine Coast, Squamish-Lillooet and the Capital region. The Fraser Valley, Nanaimo, Thompson-Nicola, Central Okanagan, Central Kootenay and Alberni-Clayoquot regions were also considered "critical."
When the numbers were broken down based on percentage of residents spending 50 per cent or more on rent, the municipality struggling the most was West Vancouver, at 37 per cent.
About a third of Richmond Hill tenants paid more than 50 per cent, 30 per cent in Vaughan, Ont., and 29 per cent in both Sechelt, B.C. and Markham.
Community profile: Metro Vancouver
Metro Vancouver's 346,000 renters spend about one per cent more of their salary than the provincial average of 23 per cent on rent and utilities. Tenants spend about $1,240 on rent and utilities in the Vancouver area, about $100 more than the B.C. average.
B.C. has the third higest average provincial rate in Canada, while Vancouver did not crack the top five municipalities.
The municipalities with the higest average rent in Canada are:
- Fort McMurray area (Wood Buffalo), Alta. - $1,805
- Whistler, B.C. - $1,655
- Rocky View, Alta. - $1,626
- Yellowknife, N.W.T. - $1,613
- Airdrie, Alta. - $1,597
StatsCan's data suggests 43 per cent of B.C. renters spend 30 per cent of their income on housing costs, while the percentage of renters spending more than half their paycheque is one per cent higher in Vancouver than the rest of B.C. at 22 per cent.
About one-in-10 households are living in what StatsCan considered "overcrowded conditions," a figure based on the Canada Mortgage and Housing Corporation's national standard.
StatsCan also looked at renters' median and average salaries. B.C. residents earn about $4,400 more than the national median of $41,586, while those in Metro Vancouver make a median $7,500 higher.
Affordability based on income
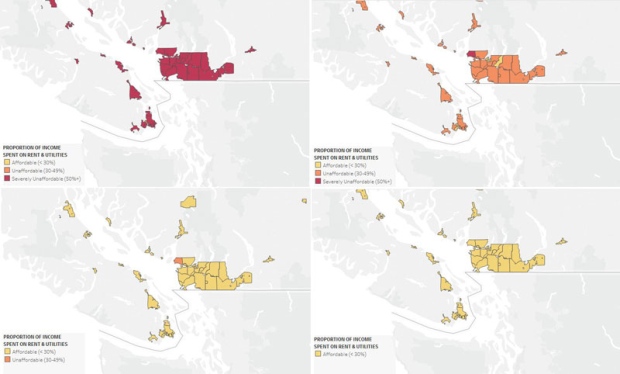
StatsCan created a tool that allows users to compare affordability based on regional levels of income. The affordability data can then be sorted and mapped based on the quartile of income a renter falls in.
For example, renters earning just under the Vancouver median fall into Q2 ($24,000 to $49,000). Based on StatsCan's data, Q2 renters pay 30 per cent or less of their income for housing in many Canadian communities.
Tenants with incomes ranked in the lowest quartile find the country "severely unaffordable," while those earning around $49,000 to $83,000 would have no issue renting across Canada.
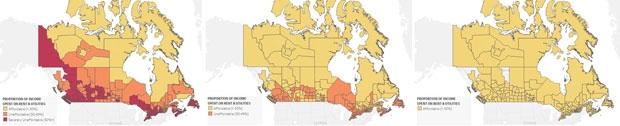
In B.C., most of the Lower Mainland and Capital regions are severely unaffordable for Q1, while Q2 renters pay between 30 and 50 per cent, still considered by StatsCan as unaffordable. The data suggests lower earners spend as much as 91 per cent of their income on housing costs in the City of Vancouver, while those in the second income group spend an average of 38 per cent of their wages.
Moderate earners spend about a quarter of their income, while the highest income group spends about 14 per cent on average.
Source for embedded maps: Canadian Rental Housing Index. View interactive versions of the data by cost, affordability, income gap, overcrowding and more in an online version of the report.